Optimize Mobility
Mobility Performance Measures
Historical Mobility Index
Mobility Index
Mobility Performance Measures
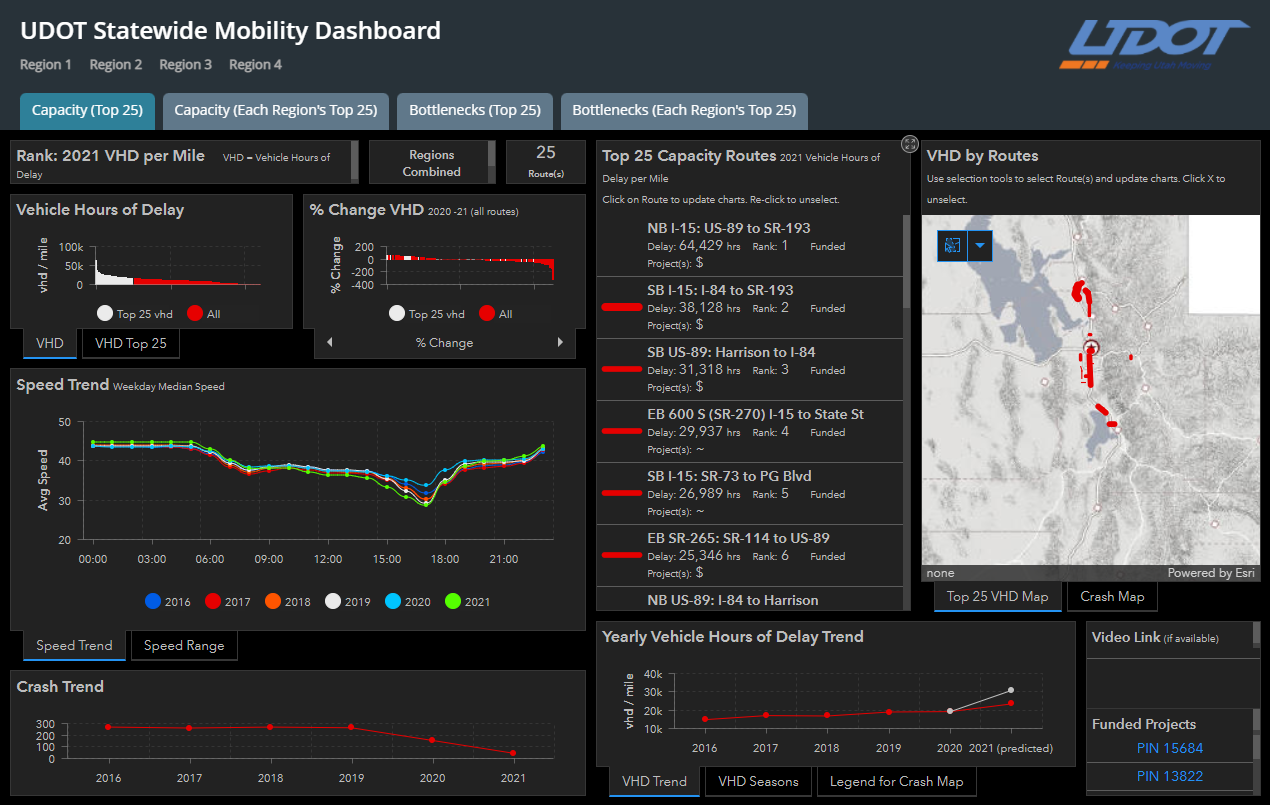
Delay
Delay is the sum of additional travel time on major routes(Interstates, highways and arterials) in the state each month. Delay is measured as the difference between the actual travel time and free-flow travel time.
*Data source changed in July 2022.
Target: Delay should not grow by more than 4% annually
Reliability
Reliability is the percent of miles on major routes that were uncongested and performed consistently with historical speeds during the peak hour.
*Data source changed in October 2022.
Target: 90% of the system will be reliable.
Transit Ridership
UTA data showing monthly weekday boardings.
Target: 1% increase of the month average value of the previous 5 years.